Mouse Carboxyterminal propeptide of type вЕ† procollagen,PвЕ†CP ELISA Kit
-
дЄ≠жЦЗеРНзІ∞пЉЪе∞ПйЉ†вЕ†еЮЛеЙНиГґеОЯзЊІеЯЇзЂѓиВљ(PвЕ†CP)йЕґиБФеЕНзЦЂиѓХеЙВзЫТ
-
иіІеПЈпЉЪCSB-E08080m
-
иІДж†ЉпЉЪ96T/48T
-
дїЈж†ЉпЉЪпњ•3800/пњ•2500
-
еЕґдїЦпЉЪ
дЇІеУБиѓ¶жГЕ
-
дЇІеУБжППињ∞пЉЪ
This Mouse PвЕ†CP ELISA Kit was designed for the quantitative measurement of Mouse PвЕ†CP protein in serum, plasma. It is a Sandwich ELISA kit, its detection range is 31.25 pg/mL-2000 pg/mL and the sensitivity is 7.81 pg/mL .
-
еИЂеРНпЉЪCarboxyterminal propeptide of type 1 procollagen,P1CP,_x000D_ Carboxyterminal propeptide of type I procollagen,PICP
-
зЉ©еЖЩпЉЪPвЕ†CP
-
зІНе±ЮпЉЪMus musculus (Mouse)
-
ж†ЈжЬђз±їеЮЛпЉЪserum, plasma
-
ж£АжµЛиМГеЫіпЉЪ31.25 pg/mL-2000 pg/mL
-
зБµжХПеЇ¶пЉЪ7.81 pg/mL
-
еПНеЇФжЧґйЧіпЉЪ1-5h
-
ж†ЈжЬђдљУзІѓпЉЪ50-100ul
-
ж£АжµЛж≥ҐйХњпЉЪ450 nm
-
з†Фз©ґйҐЖеЯЯпЉЪOthers
-
жµЛеЃЪеОЯзРЖпЉЪquantitative
-
жµЛеЃЪжЦєж≥ХпЉЪSandwich
-
з≤ЊеѓЖеЇ¶пЉЪ
Intra-assay Precision (Precision within an assay): CV%<8% Three samples of known concentration were tested twenty times on one plate to assess. Inter-assay Precision (Precision between assays): CV%<10% Three samples of known concentration were tested in twenty assays to assess. -
зЇњжАІеЇ¶пЉЪ
To assess the linearity of the assay, samples were spiked with high concentrations of mouse PвЕ†CP in various matrices and diluted with the Sample Diluent to produce samples with values within the dynamic range of the assay. гАА Sample Serum(n=4) 1:100 Average % 95 Range % 90-99 1:200 Average % 91 Range % 85-96 1:400 Average % 87 Range % 82-93 1:800 Average % 96 Range % 92-102 -
еЫЮжФґзОЗпЉЪ
The recovery of mouse PвЕ†CP spiked to levels throughout the range of the assay in various matrices was evaluated. Samples were diluted prior to assay as directed in the Sample Preparation section. Sample Type Average % Recovery Range Serum (n=5) 90 86-95 EDTA plasma (n=4) 92 88-97 -
ж†ЗеЗЖжЫ≤зЇњпЉЪ
These standard curves are provided for demonstration only. A standard curve should be generated for each set of samples assayed. 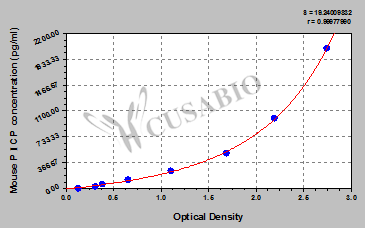
pg/ml OD1 OD2 Average Corrected 2000 2.821 2.731 2.776 2.630 1000 2.132 2.314 2.223 2.077 500 1.749 1.673 1.711 1.565 250 1.097 1.150 1.124 0.978 125 0.695 0.646 0.671 0.525 62.5 0.407 0.387 0.397 0.251 31.25 0.332 0.317 0.325 0.179 0 0.148 0.144 0.146 гАА -
жХ∞жНЃе§ДзРЖпЉЪ
-
иіІжЬЯпЉЪ3-5 working days
дЇІеУБиѓДдїЈ

зЫЄеЕ≥дЇІеУБ
Most popular with customers
-

Human Transforming Growth factor ќ≤1,TGF-ќ≤1 ELISA kit
Detect Range: 23.5 pg/ml-1500 pg/ml
Sensitivity: 5.8 pg/ml
-
-
-
Mouse Tumor necrosis factor ќ±,TNF-ќ± ELISA Kit
Detect Range: 7.8 pg/ml-500 pg/ml
Sensitivity: 1.95 pg/ml
-
-
-
-